CultureMonkey's Dashboard is a consolidated view of the survey responses gathered over time from the below surveys:
- All custom surveys
- Pulse survey
It does not include Lifecycle surveys as Lifecycle surveys solely aim towards understanding the employee's journey in the organisation.
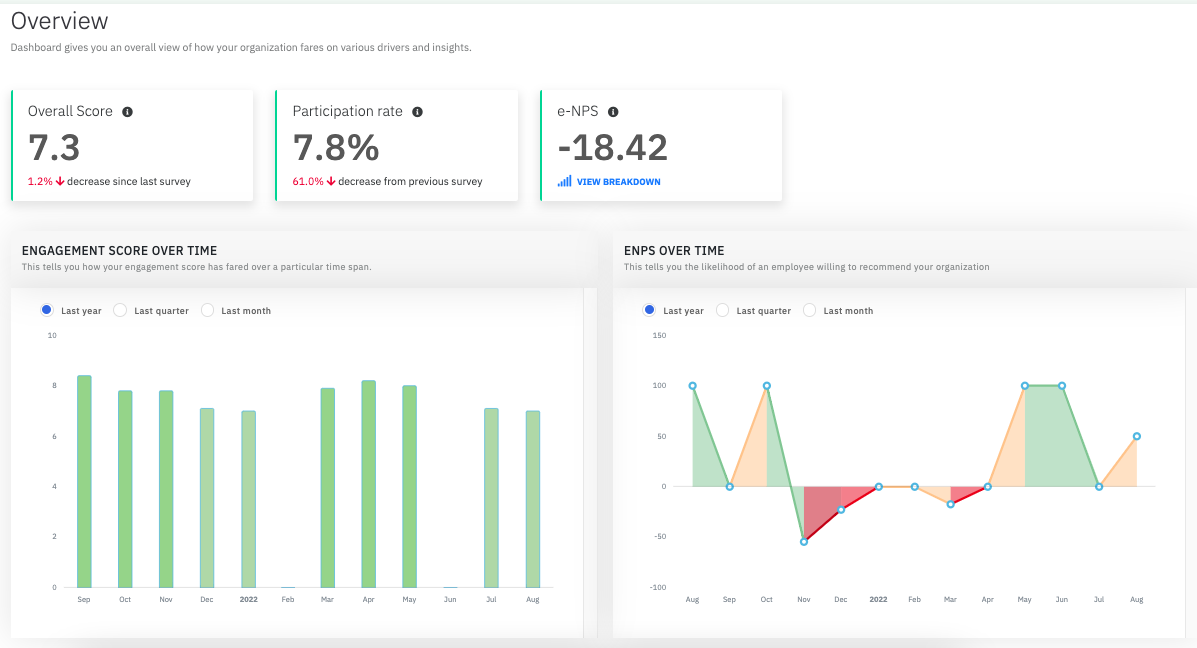
Overview
This gives you an overall view of how your organization fares on various aspects over a period of time.
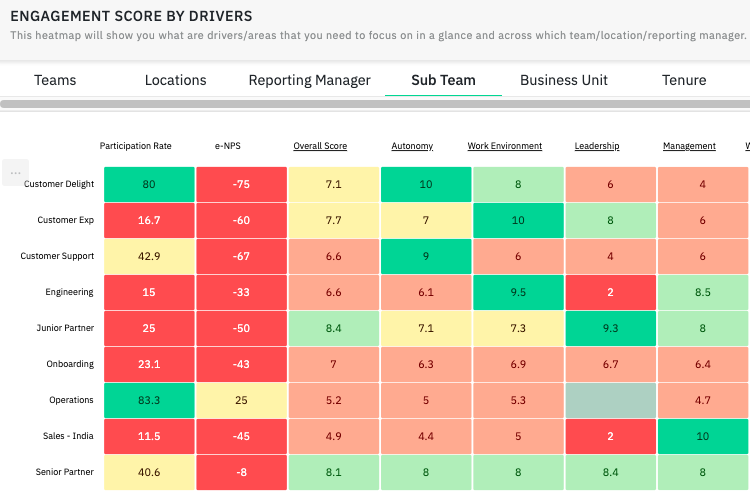
Engagement Scores by Drivers
Engagement scores by drivers, also generally called as heatmap, depicts the performance of each demographics against various drivers.
CultureMonkey's heatmap layout makes it easy for you to, at a glance, identify the things that are going well and areas that need attention.
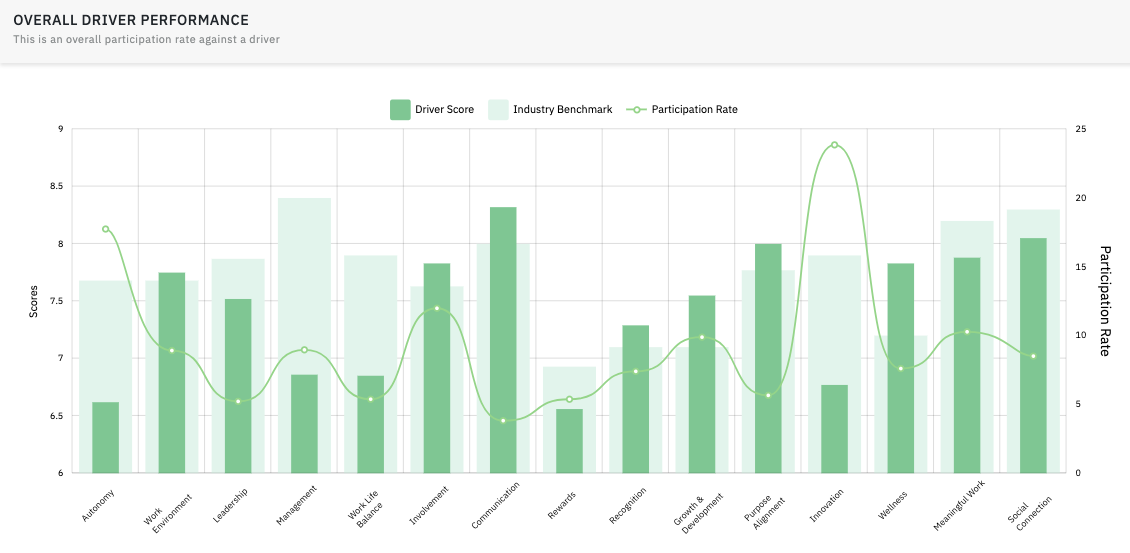
Overall Driver Performance
The overall driver performance enables you to comprehend the total participation rates and scores received for each driver across surveys.
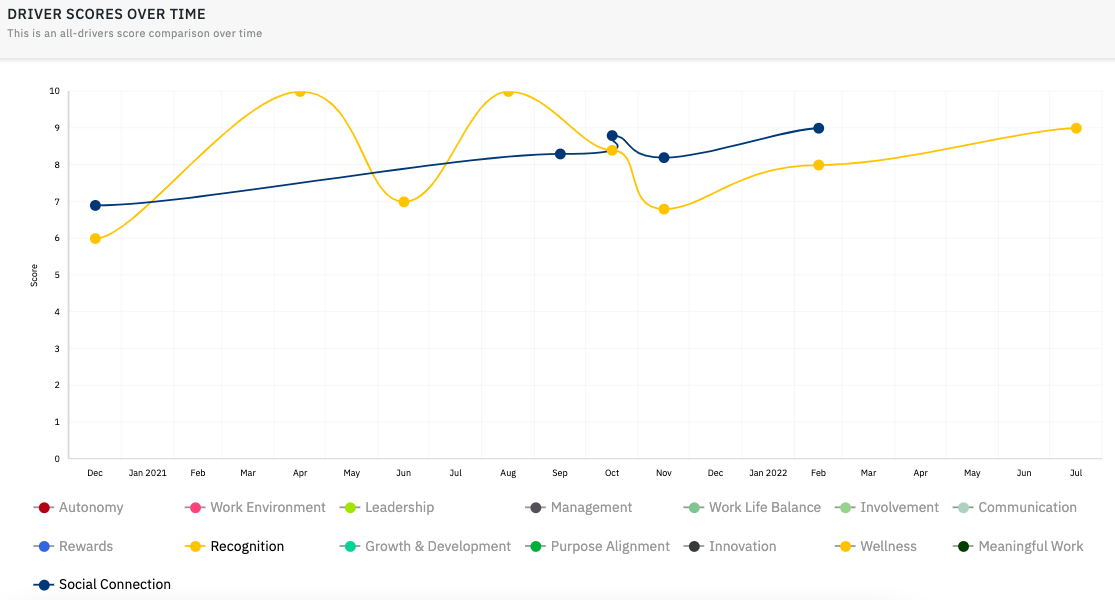
Driver Scores Over-time
Drivers have been a significant factor in data analysis. The driver scores over time allow you to assess each driver's performance over time and take corrective actions.
Please refer to survey reports in the Reports section for individual survey results.